Current Estimate of Turnout - It looks like I's will be way down and R's up. 35D/24I/38R
Explanation of Decision: As of Tuesday night, the Democrats only lead by 108,123 votes. Based on polling expectations averages, more than 300,000 Republicans voted earlier than were expected and almost 250,000 fewer Democrats voted when expected. Democrats have slightly more registered voters left to vote, 1.69m to 1.62m, but considering the inability to motivate their voters to get out for the early vote when that was their plan, this state looks likely to go to Trump. Independents could make the difference, but I think it's a safe bet to assume more Dems voted Trump than R's voted Biden.
2016 Exit Polls - 32D/34I/33R without leaners (PDF)
D+1 is unlikely, assuming R+3. This is an online only poll, which favor Democrats on average, so an adjustment will be applied. See explanation of the online adjustment.
The voter turnout this year will be different than usual. Assuming 35D/24I/38R. According to the data, Biden won D's 94-4, Trump won I's at 44-46 and R's 91-8. Applying these ratios to the turnout, Biden receives 46.5 to Trump 47.5.
The even turnout is optimistic for D's. Will assume a midpoint between 2016 and 2018, considering 2018 was a big turnout year for Dems. 42D/12I/44R. According to the data, Biden won D's 87-6, I's 49-43 and Trump won R's 84-9. Applying the voter ratios to the more likely turnout, Biden receives 46 to Trump 44.
The gender demographics were more favorable to Dems in this poll than the last election, matched racial demographics and were slightly more favorable to Republicans with age assumptions. No adjustment necessary.
D+1 is unlikely, assuming R+3. This is an online only poll, which favor Democrats on average, so an adjustment will be applied. See explanation of the online adjustment.
The voter turnout this year will be different than usual. Assuming 35D/24I/38R. According to the data, Biden won D's 94-4, Trump won I's at 44-46 and R's 91-8. Applying these ratios to the turnout, Biden receives 46.5 to Trump 47.5.
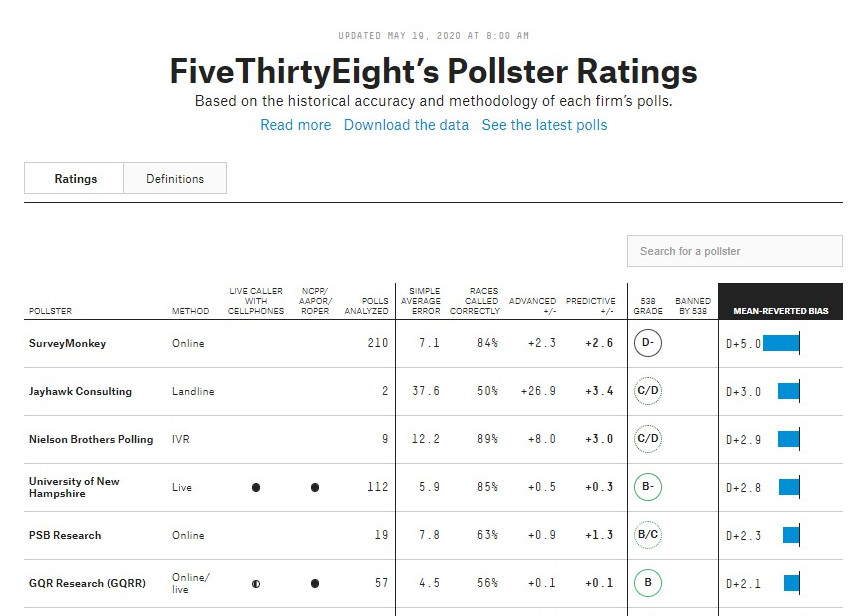
Biden won D's 96-2, I's 62-31 and Trump won R's 94-5. This pollster has the most pro-Democrat mean-reverted bias on fivethirtyeight.com, +5.0 more favorable to Dems. (Screenshot, Direct Link). This is also an online only poll, which favor Democrats on average, so an adjustment will be applied. See explanation of the online adjustment.
The even turnout is optimistic for D's. Will assume a midpoint between 2016 and 2018, considering 2018 was a big turnout year for Dems. 42D/12I/44R. According to the data, Biden won D's 87-6, I's 49-43 and Trump won R's 84-9. Applying the voter ratios to the more likely turnout, Biden receives 46 to Trump 44.
The gender demographics were more favorable to Dems in this poll than the last election, matched racial demographics and were slightly more favorable to Republicans with age assumptions. No adjustment necessary.
The D+3 sample oversamples Democrats. Will adjust to 44D/8I/46R. Voter ratios are not provided but can be inferred. Biden had a 3-point partisan advantage and a 2-point lead, suggesting Trump did slightly better across party. Assuming Biden won D's 92-5, I's split 45-46 and Trump won R's 93-4. Applying the voter ratios to the more likely turnout, Biden receives 45.9 to Trump 48.8.
The D+1.7 turnout includes too many Dem's. Will adjust to 35D/27I/36R. The voter ratios are not provided but can be inferred. Biden had a 1.7% turnout advantage and a 3-point lead, suggesting he did slightly better (4%) with Independents and Republicans than Trump did with Independents and Democrats. Assuming Biden won D's 90-5, I split 45-45 and Trump received 88-7. Adjusted, Biden receives 46.2 to Trump 45.6.
The D+2 sample oversamples Dems, will adjust to R+1, or 32D/34I/33R. Voter ratios were not provided but can be inferred. Biden had a 2-point turnout advantage but trails by 4, meaning Biden did 6 points (18% among 3 party groups) worse among Republicans and Independents than Trump did among Democrats and Independents. Assuming Biden won D's 88-6, Trump won I's 50-38 and R's 92-4. Applying the voter ratios to the more likely party distribution, Biden receives 42.4 to Trump 49.3.
The pollsters weights their results to the chart of active voters in Florida, which only includes voters who have voted in the last four years. One must ask, which candidate is more likely to bring out new voters? Because people typically register to vote "for," not "against," the answer is Trump. The evidence shows Republicans have registered 377,196 and the Democrats 290,181 since 2016, so it's reasonable to assume this poll undersamples Republicans. This amounts to a 0.8% gain for the GOP, adjusted Biden 50, Trump 47.8.
The party distribution is not reported for likely voters, but is for registered voters. It is consistent with 2016. Trump performs much better with likely voters in Florida, which is somewhat expected but may indicate that Trump's enthusiasm advantage is showing up more now that real likely voter screens (not self-identified) are being applied.
702LV, Party distribution not provided. This poll notes that the timing of the poll, just after Ginsburg's death, may artificially boost Biden's number.
Biden 49, Trump 46
x
Political Ref's take on the above poll
Neither party distribution nor voter ratios of those parties is provided.
The R+4 sample slightly oversamples Republicans but is reasonable. The bigger problem is that this is a registered voter poll, so a registered voter filter must be applied to the I column. Simply put, more Democrats and Democrat leaning Independents than Republicans fail to actually vote on average. To see how this filter works, see our voter turnout assumptions page. Adjusted, Biden receives 40.0 to Trump 45.0. This number will be offset somewhat by adjusting the Republican partisan advantage from +4 to +1 by adding 3% to the D column. Biden won D's 91-2 in this poll, so the final adjustment, Biden 42.7 to Trump 45.1.
The party distribution seems reasonable. This is a likely voter sample. Biden won D's 94-5, I's 51-40 and Trump won R's 94-5. Monmouth assumes a voter turnout of 73%, which is just under the 2016 turnout of 75%. I think this points to a missed vote that will lean Trump in the state. See the Knight Foundation 100 Million Project. No adjustment necessary.
The D+2 sample slightly oversamples Democrats. Will assume an R+1 voter turnout, or 32D/34I/33R. Voter ratios are not provided but can be inferred. Trump leads by 3 but had a D+2- turnout assumption, meaning Trump did 5 points (15%) better with Dens and Independents than Biden did with Republicans. To account for this 15%, assuming Biden won D's 88-7, Trump won I's 49-39 and Trump won R's 92-6, Biden receives 43.4 to Trump 49.3.
The D+2 sample oversamples Democrats. Adjusting to the more likely 32D/34I/33R 2016 turnout. Biden had a +2 turnout advantage but leads by 4, so he likely did slightly better with Independents than Trump. Will assume Biden won Independents 12-10, or 50-42%. This is a registered voter poll so a registered voter screen will be applied to the Independent column. Bidens loses 17 and Trump 12.7, adjusted Biden 33 to Trump 29.3. Applying that ratio to the 31% out of 34% likely to pick Trump or Biden, Biden wins Independents 16.4-14.6. Assuming the candidates each win their parties 90-5, Biden receives 46.8 to Trump 45.9.
Party distribution is not provided but voter ratios are. Biden won D's 94-5, I's split 46 Biden and 44 Trump, and Trump won R's 93-5. Applying these ratios to the likely voter turnout of 32D/34I/33R, Biden receives 47.4 to Trump 47.3
The D+2 sample oversamples Democrats. Adjusting to the more likely R+1, 42D/16I/43R. Biden won D's 87-9, I's 52-43 an Trump won R's 87-10. Applying these voter ratios to the more likely turnout, Biden receives 49.2 to Trump 48.1. Keep in mind also, this is a registered voter poll and likely includes more Democratic votes that will fail to actually vote in the election than Republican votes. The margin is probably closer than even this adjusted result, and Trump may be ahead.
685LV, Party distribution for the state not provided
Biden 48, Trump 45
Repeat
Political Ref's take on the above poll
The party distribution for all six battleground states in the poll was 36D/30I/34R. This comes close to the turnout for all six states combined in 2016 according to the exit polls, which is 35.3D/31.2I/33.5R. I think these are there most credible battleground state polls by Change Research yet. Unfortunately, state specific information is required to assess the credibility of this polls, which is the purpose of the Freedom Window average. Full explanation below.
This sample uses a bad voter turnout assumption in that it spikes the Independent share of the vote well above both parties. This will not happen. Adjusting to the 2016 voter turnout of 32D/34I/33R. Voter ratios are not provided but can be inferred. Parties were even in the original turnout assumption and Biden leads by 5, so we will assume that Biden carried Independents by 5 although in reality it was probably less and Biden won more Democrats than Trump won Republicans. For the purposes of the calculation, however, the fiction should produce a relatively accurate adjustment. Assuming each candidate won his party 90-5 and Biden won Independents 22.5-17.5, or 56%-44%, and a voter turnout of 32D/34I/33R, Biden receives 49.5 to Trump 46.3. It is important to note that this is a poll of registered voters and these polls almost always give a bump to the Democrat that does not manifest on election day, but not every time. For this reason, the margin is likely closer than even this adjusted result.
The D+6 sample oversamples Democrats. Adjusting to the more likely 2016 turnout, 32D/34I/33R. According to the poll data, Biden won D's 89-2, I's 48-32 and Trump won R's 88-10. Reallocating these voter ratios to the more likely voter turnout, Biden receives 47.6 to Trump 40.3. It is important to note that this is a poll of registered voters and these polls almost always give a bump to the Democrat that does not manifest on election day, but not every time. For this reason, the margin is likely closer than even this adjusted result.
The D+2.3 sample oversamples Democrats. Adjusting to the more likely R+1 sample, 32D/34I/33R from 2016. Biden won D's 91-3, I's split 39-39 and Trump won R's 86-9. Reallocating these voter ratios to the more likely voter turnout, Biden receives 45.4 to Trump 42.6.
The D+4 sample definitely oversamples Democrats. Adjusting to the much more likely R+1 sample we saw in 2016, D39/20I/40R. The Biden/Trump vote ratios of each party are not provided but can be inferred. Biden had a D+4 advantage when Trump should have had an R+1 advantage in the sample, so that's a five-point change. Biden had a nine-point lead, however, so he must have won Independents big, by about 4 total points, or 9.5 to 5.5 out of the 15 I's, or 60% to 40%. Assuming each candidate wins their party 90-5 and Independents break 60-40 for Biden, the adjusted result is Biden 49.1 to Trump 46. Keep in mind that this is a poll of registered voters and Democratic leaning registered voters typically fail to vote in as high a turnout percentage of Republican leaning registered voters. For this reason, the margin is likely closer than this number suggests or Trump is ahead, but because the pollster chose not to screen out unlikely votes we are stuck with this unlikely result.
There is a strong chance that Sienna failed to pick up some of the Trump vote among Independents as noted by other poll analysts. The results among Independents are far out of step with other pollsters like YouGov showing a dead heat in the group. Also, this poll includes 10% of Independents, 5% of Republicans and 2% of Democrats who said they are only somewhat likely to vote or not at all likely to vote. These voters should not be included in a poll and pollsters will exclude these respondents when filtering for likely voters. Pollsters know that inclusion of these respondents changes the numbers substantially, so why include them? Not only will these voters not vote, but many voters who self-report as likely to vote, and even some who say they are certain to vote, will also not vote. But this category of somewhat likely to vote or will not vote at all is low hanging fruit for a pollster seeking likely voters (accuracy). I will consider this poll's results once it imposes a likely voter screen. The results are too out of the mainstream to ignore the refusal to impose a likely voter screen. Excluded from this average.
The D+3 sample is high on the Dem side. Adjusting to the 2016 32D/34I/33R turnout. D's voted 93-3 for Biden, R's 84-10 for Trump and I's 46-30 for Biden. Applying the partisan vote percentages to the 2016 turnout, the initial adjustment is 48.7 Biden to 38.9 Trump.
This is a R+0.5 party distribution. In 2016 the party distribution in the exit polls was 32D/34I/33R. Florida has actually become less Democratic by 0.8% and more Republican by 1% since 2016. The registrations show 37.2D/35.3R with 27.5 I's or third parties, but Republicans voter turnout tends to be higher. This Cygnal poll shows a reasonable partisan distribution. No adjustment necessary.
This poll assumes a 38D/24I/38R party distribution. Florida has actually become less Democratic by 0.8% and more Republican by 1% since 2016. The registrations show 37.2D/35.3R with 27.5 I's or third parties. But Republicans voter turnout tends to be higher, which is why the GOP does well here lately. This poll has a reasonable party ID turnout, so I'm not going to adjust it.
This poll uses a questionable method of determining who is a likely voter. Rather than eliminate the vote of those stating they are leaning against voting or those aren't sure if they will vote, their votes are included but weighted down. So if someone says they are leaning towards not voting, that person's vote is still counted but weighted down by 80%. This method likely inflates the Democrat share of the vote by a point to a few points. A better likely voter screen probably finds Trump a bit higher and Biden a bit lower. To be conservative, I'm assuming a +1 for Trump, -1 for Biden. The adjustment should probably be more to be an accurate reflection of voter intent, but I try to be conservative in adjustments. Adjusted result Biden 44, Trump 44. To see this explanation, you will need to submit your email to Redfield & Wilton.
The poll assumed a 32D/34I/33R party ID turnout. Florida has actually become less Democratic by 0.8% and more Republican by 1% since 2016. The registrations show 37.2D/35.3R with 27.5 I's or third parties. But Republicans voter turnout tends to be higher, which is why the GOP does well here lately. This poll has a reasonable party ID turnout, so I'm not going to adjust it.
The poll shows Dems and R's virtually even. Exit polls showed D+3, R+1, D+1 (Fox News, NBC, ABC). So assuming the same this time, a safe assumption considering GOP enthusiasm higher than Dems in 2020, this poll has a reasonable party distribution. No adjustment necessary.
No Adjustment Necessary
>1month
To see results of 2016 Florida polls below, click here
Best 2016 Florida Poll: Trafalgar Group
Polls that got Florida right: Bloomberg, Trafalgar Group, UPI/CVoter, Remington Research, NYT/Sienna College, Dixie Strategies, Google Consumer Surveys


