|
|
 |
POLLSTERS: Biden +5.7, Biden 50.2, Trump 44.5
REF'S AVG: Biden +4.2, Biden 49.6, Trump 45.4 |
| RETURN TO ALL BATTLEGROUND STATES |
| CURRENT ESTIMATE OF TURNOUT: 40D/20I/39R. I have used the 2016 Exit Polls for two reasons. Exit polls are better than other polls and they have a Democratic bias, which is what caused many in the media to doubt Trump's win late into election night. Using a Dem biased poll is a bit of brake on my tendencies, to guard against making too bold of an assumption. The 2016 Michigan exit is perhaps the worst exit poll out there. Because Democrats had a huge turnout in 2018, I am opting to lean toward the 2018 exit polls in my assumption. |
| 2016 Exit Polls - 40D/29I/31R without leaners (PDF), 27Lib/37Mod/36Con |
| 2018 Exit Polls - 42D/15I/43R with leaners (PDF) |
| Pollsters' Averages Chart |
Political Ref's Averages Chart |
|
|
|
| POLL RESULT SUMMARY (SEE FULL RESULTS & EXPLANATIONS BELOW) |
| Poll |
Date |
Sample + Party Distribution |
Result |
Pollster Avg |
Ref's Avg |
| Trafalgar Group |
10/30-10/31 |
1033LV, Party distribution not provided |
Biden 46, Trump 48 |
x |
|
| Political Ref's Take on the above poll |
The gender, racial and age demographics are consistent with the most recent exit polls. |
Included |
|
x |
| Insider Adv |
10/30-10/31 |
500LV, 30D/29I/38R |
Biden 48.8, Trump 46.7 |
x |
|
| Political Ref's Take on the above poll |
Too many R's. Adjust, 32D/29I/36R. Data: Biden 86-13D, 55-36I, Trump 82-17R, Biden 51.0 to Trump 42.7 |
Biden 49.6, Trump 44.1 |
|
x |
| Emerson |
10/29-10/31 |
700LV, 36D/25I/39R |
Biden 52, Trump 45 |
x |
|
| Political Ref's Take on the above poll |
No adjustment necessary |
Included |
|
x |
| 46RMG Research |
10/27-10/29 |
800LV, 37D/30I/33R |
Biden 51, Trump 44 |
x |
|
| Political Ref's Take on the above poll |
I am adjusting the turnout to 40D/20I/39R. Ratios: 95-5D/46-39I/92-7R. Adjusted, Biden receives 49.9 to Trump 45.7. |
Biden 49.9, Trump 45.7 |
|
x |
| Univ of Wisconsin-YouGov |
10/13-10/21 |
681LV, Party distribution not provided |
Biden 52, Trump 42 |
x |
|
| Political Ref's Take on the above poll |
Neither party distribution or voter ratios provided. |
Excluded |
|
x |
| Gravis Marketing |
10/24 |
679LV, 37D/34I/30R |
Biden 55, Trump 42 |
x |
|
| Political Ref's Take on the above poll |
The D+7 includes too few Dems, far too few R's and too many I's. Will adjust to 40D/20I/39R. Voter ratios are not provided but can be inferred. Biden has a 13-point lead with a 7-point partisan advantage, suggesting Biden did well across party. Will assume Biden won D's 97-2, I's 50-38 and Trump won R's 90-5. Adjusting, Biden receives 50.8 to Trump 43.5. |
Biden 50.8, Trump 43.5 |
|
x |
| Zia Poll |
10/11-10/18 |
2851LV, Party distribution not provide |
Biden 45.0, Trump 49.0 |
x |
|
| Political Ref's Take on the above poll |
Neither party distribution or voter ratios are not provided. |
Excluded |
|
|
| Fox News |
10/17-10/20 |
1032LV, 45D/14I/41R |
Biden 51, Trump 40 |
x |
|
| Political Ref's Take on the above poll |
This poll assumes a 93% turnout among registered voters. This will not happen. |
Excluded |
|
|
| Ipsos |
10/14-10/20 |
686LV, Party distribution for LV not provided |
Biden 51, Trump 44 |
x |
|
| Political Ref's Take on the above poll |
Neither party distributions for voter ratios are provided. This is an online only poll, which favor Democrats on average, so an adjustment will be applied. See explanation of the online adjustment. |
Biden 49, Trump 46 |
|
x |
| FULL POLL RESULTS AND EXPLANATIONS OF ADJUSTMENTS |
| Poll |
Date |
Sample + Party Distribution |
Result |
Pollster Avg |
Ref's Avg |
| RMG Research |
10/27-10/29 |
800LV, 37D/30I/33R |
Biden 51, Trump 44 |
x |
|
| Political Ref's Take on the above poll |
I am adjusting the turnout to 40D/20I/39R. Ratios: 95-5D/46-39I/92-7R. Adjusted, Biden receives 49.9 to Trump 45.7. |
Biden 49.9, Trump 45.7 |
|
x |
| Univ of Wisconsin-YouGov |
10/13-10/21 |
681LV, Party distribution not provided |
Biden 52, Trump 42 |
x |
|
| Political Ref's Take on the above poll |
Neither party distribution or voter ratios provided. |
Excluded |
|
x |
| Gravis Marketing |
10/24 |
679LV, 37D/34I/30R |
Biden 55, Trump 42 |
x |
|
| Political Ref's Take on the above poll |
The D+7 includes too few Dems, far too few R's and too many I's. Will adjust to 40D/20I/39R. Voter ratios are not provided but can be inferred. Biden has a 13-point lead with a 7-point partisan advantage, suggesting Biden did well across party. Will assume Biden won D's 97-2, I's 50-38 and Trump won R's 90-5. Adjusting, Biden receives 50.8 to Trump 43.5. |
Biden 50.8, Trump 43.5 |
|
x |
| Zia Poll |
10/11-10/18 |
2851LV, Party distribution not provide |
Biden 45.0, Trump 49.0 |
x |
|
| Political Ref's Take on the above poll |
Neither party distribution or voter ratios are not provided. |
Excluded |
|
|
| Trafalagar Group |
10/11-10/14 |
1025LV, Party distribution not provided |
Biden 45, Trump 46 |
x |
|
| Political Ref's Take on the above poll |
As to democraphics, this poll was more favorable to Dems on gender, GOP on race and reflected accuratey the distribution. |
Included |
|
x |
| HarrisX |
10/12-10/15 |
1289LV, Party distribution not available |
Biden 54, Trump 43 |
x |
|
| Political Ref's Take on the above poll |
Neither party distribution or voter ratios are available. |
Excluded |
|
|
| RMG Research |
10/8-10/13 |
800LV, Party distribution not provided |
Biden 48, Trump 42 |
x |
|
| Political Ref's Take on the above poll |
RMG provides a model with a strong Republican turnout, which I believe the evidence supports. I will use that number in my average. |
Biden 46, Trump 44 |
|
x |
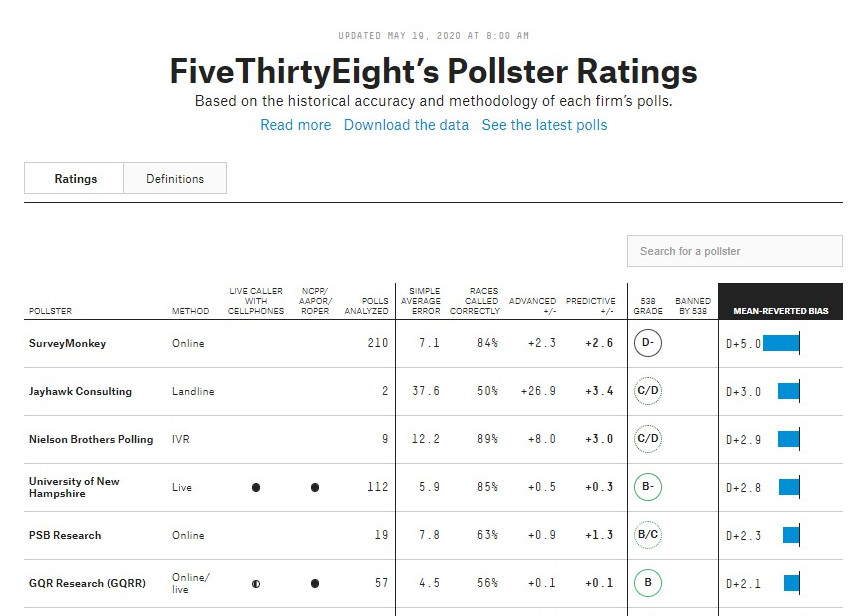
| Survey Monkey |
9/15-10/12 |
4656LV, Error in reporting |
Biden 51, Trump 46 |
x |
|
| Political Ref's Take on the above poll |
This pollster has the most pro-Democrat mean-reverted bias on fivethirtyeight.com, +5.0 more favorable to Dems. (Screenshot, Direct Link). This is also an online only poll, which favor Democrats on average, so an adjustment will be applied. See explanation of the online adjustment. |
Biden 49.5, Trump 47.5 |
|
x |
| Ipsos |
10/7-10/13 |
620LV, 46D/10I/40R |
Biden 51, Trump 44 |
x |
|
| Political Ref's Take on the above poll |
The D+6 sample oversamples D's. Will adjust to 43D/10I/42R. Voter ratios are not provided but can be inferred. Biden had a 6-point partisan advantage and a 7-point lead, suggesting Biden did slightly better across party. Assuming Biden won D's 92-4, I's split 46-45 and Trump won R's 90-5. Applying the voter ratios to the more likely turnout, Biden receives 46.3 to Trump 44.0. |
Biden 46.3, Trump 44.0 |
|
x |
| New York Times/Sienna College |
10/8-10/11 |
614"LV," 32R/29I/33R |
Biden 48, Trump 40 |
x |
|
| Political Ref's Take on the above poll |
I do not include New York Times polls in my averages because they do not reveal the number of voters polled to find it's likely voter pool. This is a constant and fundamental failure of Transparency that can impact Independents in particular, where they often find their leads for Democrats. |
Excluded |
|
|
| Baldwin Wallace Univ Great Lakes polls |
9/30-10/8 |
1134LV (Outside of 3.2% Margin of Error), 42D/22I/37R |
Biden 50.2, Trump 43.2 |
x |
|
| Political Ref's Take on the above poll |
Adjusting to 40D/20I/39R. According to the data, Biden wins D's 94-2, I's 44-39 and Trump wins R's 92-4. Applying the voter ratios to the more likely turnout, Biden receives 48.0 to Trump 44.5. An online poll adjustment will not be made when another adjustment is made. |
Biden 48.0, Trump 44.5 |
|
x |
| YouGov |
10/6-10/9 |
1190"LV," (This is really a registered voter poll as it assumes a 99% registered voter turnout). 35D/30I/32R |
Biden 52, Trump 46 |
x |
|
| Political Ref's Take on the above poll |
The party distribution is reasonable. Will apply a registered voter filter to the I column. According to the data, Biden won D's 96-4, I's 52-43 (35-30.3) and Trump won R's 95-5. Applying the voter ratios to the more likely turnout, Biden receives 45.7 to Trump 40.9 |
Biden 45.7, Trump 40.9 |
|
x |
| Ipsos |
9/29-10/6 |
709LV, Party distribution not provided |
Biden 51, Trump 43 |
x |
|
| Political Ref's Take on the above poll |
This is an online only poll, which favor Democrats on average, so an adjustment will be applied. See explanation of the online adjustment. |
Biden 49.0, Trump 45.0 |
|
x |
| PPP |
9/30-10/1 |
746RV, 36D/28I/36R |
Biden 50, Trump 44 |
x |
|
| Political Ref's Take on the above poll |
This a registered voter poll and a registered voter filter will be applied. Adjusted, Biden 48.2 to Trump 45.8. |
Biden 48.2, Trump 45.8 |
|
x |
| Trafalgar Group |
9/26-9/28 |
1042LV, Party distribution not provided |
Biden 49, Trump 47 |
x |
|
| Political Ref's Take on the above poll |
This was the most accurate state poll in Michigan last cycle. |
Included |
|
x |
| Marist College |
9/19-9/23 |
799LV, 31D/36I/31R |
Biden 52, Trump 44 |
x |
|
| Political Ref's take on the above poll |
The party distribution looks reasonable and it's a likely voter poll. |
Included |
|
x |
| Trafalgar Group |
9/20-9/22 |
1015LV, Party distribution not provided |
Biden 46, Trump 47 |
x |
|
| Political Ref's take on the above poll |
Party distribution is not provided but Trafalgar group was the most accurate pollster in Michigan in 2016, so it should be included. |
Included |
|
x |
| YouGov |
9/10-9/21 |
641LV, D+8 for a three-state sample (PA, MI, WI) |
Biden 51, Trump 45 |
|
|
| Political Ref's take on the above poll |
Neither party distribution nor voter ratios of those parties is provided. |
Excluded |
|
|
| Baldwin Wallace University/Great Lakes polls |
9/8-9/22 |
1001LV, 41D/23I/37R |
Biden 50, Trump 42 |
x |
|
| Political Ref's take on the above poll |
Party distribution is reasonable. No adjustment necessary. |
Included |
|
x |
| Change Research |
9/18-9/20 |
702LV, Party distribution not provided. This poll notes that the timing of the poll, just after Ginsburg's death, may artificially boost Biden's number. |
Biden 51, Trump 43 |
x |
|
| Political Ref's take on the above poll |
Neither party distribution nor voter ratios of those parties is provided. |
Excluded |
|
|
| Marketing Resource Group |
9/14-9/19 |
600LV, +4 Dem Sample |
Biden 46, Trump 41 |
x |
|
| Political Ref's Take on the above poll |
The D+4 is reasonable. No adjustment necessary. |
Included |
|
x |
| Ipsos |
9/11-9/16 |
637LV, 45D/11I/39R |
Biden 49, Trump 44 |
x |
|
| Political Ref's Take on the above poll |
The party distribution is reasonable. No adjustment necessary. |
Included |
|
x |
| EPIC-MRA |
9/10-9/15 |
600LV, Partisan distribution not provided |
Biden 48, Trump 40 |
x |
|
| Political Ref's Take on the above poll |
Neither party distribution or voter ratios provided. |
Excluded |
|
x |
| Benenson Strategy Group/GS Strategy Group |
8/28-9/8 |
1600LV, Party distribution not provided |
Biden 50, Trump 43 |
x |
|
| Political Ref's Take on the above poll |
Neither party distribution nor voter ratios of those parties is provided. |
Excluded |
|
|
| Rasmussen Reports |
9/2-9/3 |
1000LV, Party distribution not provided |
Biden 53, Trump 44 |
x |
|
| Political Ref's Take on the above poll |
Neither party distribution nor voter ratios of those parties is provided. |
Excluded |
|
|
| Morning Consult |
8/29-9/7 |
1455LV, Party distribution not provided |
Biden 52, Trump 42 |
x |
|
| Political Ref's Take on the above poll |
Neither party distribution or voter ratios within those parties are provided. |
Excluded |
|
|
| Change Research |
9/4-9/6 |
809LV, Party distribution not provided |
Biden 49, Trump 43 |
x |
|
| Political Ref's Take on the above poll |
Neither party distribution nor voter ratios of those parties is provided. |
Excluded |
|
|
| Morning Consult |
8/21-8/30 |
1424LV, Party distribution not provided |
Biden 52, Trump 42 |
Repeat |
|
| Political Ref's Take on the above poll |
Neither party distribution or voter ratios within those parties are provided. |
Excluded |
|
|
| Change Research |
8/7-8/9 |
413LV, Party Distribution Not Provided |
Biden 48, Trump 43 |
Repeat |
|
| Political Ref's Take on the above poll |
Neither party distribution or voter ratios within those parties are provided. |
Excluded |
|
|
| Trafalgar Group |
8/14-8/23 |
1048LV, Party Distribution not Provided |
Trump 46.6, Biden 45.2 |
x |
|
| Political Ref's Take on the above poll |
Neither party distribution or voter ratios within those parties are provided. |
Excluded |
|
|
| Civiqs |
8/13-8/17 |
631RV, 36D/36I/28R |
Biden 49, Trump 46 |
x |
|
| Political Ref's Take on the above poll |
The D+8 sample is within the reasonable range. This is a registered voter poll so a registered voter screen will be applied. Assuming 31% of respondents fail to show up and actually vote, 55% of which are D leaning and 41% of which lean Republican. Adjusted, Biden receives 32 to Trump 33.3. Applying the 32/33.3 ratio to the 95% of respondents who chose Biden or Trump, Biden receives 46.6 to Trump 48.4. |
Biden 46.6, Trump 48.4 |
|
x |
| Univ. of Wisconsin/YouGov |
7/27-8/6 |
761RV, Across three states (PA, MI, WI) the party distribution was 36D/36I/29R. |
Biden 47, Trump 43 |
x |
|
| Political Ref's Take on the above poll |
Party distribution looks reasonable. No adjustment necessary. This poll took place prior to the conventions, when I was doing fewer registered voter poll adjustments. |
Biden 47, Trump 43 |
|
x |
| Epic-MRA |
7/25-7/30 |
600LV, 44D/14I/39R |
Biden 51, Trump 40 |
>1month |
|
| Political Ref's Take on the above poll |
This is a leaners voter turnout assumption. When leaners were asked to choose in the 2018 exit polls in Michigan, Republicans outnumbered Democrats. Republicans turn out better in non-presidential years. Overall turnout drops about 20% in non-presidential years. It is reasonable to assume more Democrats come out in presidential years, but a six-point swing when compared to non-presidential years seems like too much considering that Democrats won in 2018 and much of Trump's non-traditional base stayed home. It seems reasonable to assume Dems could gain three or four points in presidential years, but not six. This poll turnout assumption comes close, however, so no adjustment is necessary. |
Included |
|
>1month |
| Change Research |
7/24-7/26 |
413LV, Party distribution for the state not provided |
Biden 46, Trump 42 |
Repeat |
|
| Political Ref's Take on the above poll |
The party distribution for all six battleground states in the poll was 36D/30I/34R. This comes close to the turnout for all six states combined in 2016 according to the exit polls, which is 35.3D/31.2I/33.5R. I think these are there most credible battleground state polls by Change Research yet. Unfortunately, state specific information is required to assess the credibility of this polls, which is the purpose of the Freedom Window average. Full explanation below. |
Excluded |
|
|
| Morning Consult |
7/17-7/26 |
1320LV, Party distribution not provided |
Biden 52, Trump 42 |
>1month |
|
| Political Ref's Take on the above poll |
Neither party distribution or voter ratios within those parties are provided. |
Excluded |
|
|
| YouGov |
7/21-7/24 |
1156LV, 36D/29I/33R |
Biden 48, Trump 42 |
Repeat |
|
| Political Ref's Take on the above poll |
The party distribution falls between the 2016 and 2018 turnouts. No adjustment necessary. |
Included |
|
Repeat |
| Gravis Marketing |
7/22 |
754LV, 37D/34I/30R |
Biden 51, Trump 42 |
>2weeks |
|
| Political Ref's Take on the above poll |
The party distribution has too many Independents, but the D+7 is defensible. That comes close to 2016. No adjustment necessary |
Included |
|
>2weeks |
| Fox News |
7/18-7/20 |
756RV, 44D/16I/40R |
Biden 49, Trump 40 |
>2weeks |
|
| Political Ref's Take on the above poll |
This is a voter sample that pushed leaners to choose a party. When comparing polls that push leaners to pick a party with those that do not, Michigan looks more Republican when leaners are pushed to pick. So this voter turnout assumption is consistent with the 2016 and 2018 exit polls because it is presidential year. It should not match 2018 exactly because the GOP turns out better in non-presidential years. It should fall somewhere between R+1 and D+9, which it does, at D+4. No adjustment necessary. It should be noted, however, that this is a registered voter, as opposed to a likely voter poll, which almost always favor Democrats. The margin is likely closer than what this poll shows. |
Included |
|
>2weeks |
| Spry Strategies |
7/11-7/16 |
700LV, 31.4D/36I/29.6R |
Trump 49.6, Biden 45.4 |
>2weeks |
|
| Political Ref's Take on the above poll |
The Independent column is somewhat high, suggesting that some leaners picked a party and some did not. In 2018 when leaners were pushed to pick, the state was R+1. In 2016 when they were not forced, the state was D+9. So it's hard to say. The result between Peters and James is consistent with other polls (+10 for Peters) with a solid voter turnout assumption, although it is inconsistent on the presidential line. Bottom line, the high amount of Independents and conflicting results makes this one difficult, but on balance I think no adjustment is necessary. Another point, this is a likely voter poll with a seemingly strong likely voter screen. I am more reluctant to adjust polls with solid likely voter screens. They pick up on who is actually going to come out and vote. |
Included. |
|
>2weeks |
| PPP |
7/9-7/10 |
1041RV, 38D/29I/33R |
Biden 51, Trump 44 |
>2weeks |
|
| Political Ref's Take on the above poll |
The D+5 sample under-samples Democrats. Will adjust to the more likely 2016 model, 40D/29I/31R. Voter ratios within the parties are not provided but can be inferred. Biden had a D+5 turnout assumption but a 7 point lead, which suggests he was stronger among Independents and Republicans than Trump was with Independents and Democrats. Will assume each candidate won their party 90-5 and that Trump won Independents by 2, or 15.5-13-5 or 53% to 47%. Reallocating these voter ratios to the more likely turnout, Biden receives 52.9 to Trump 43.5. |
Biden 52.9, Trump 43.5 |
|
>2weeks |
| Change Research |
7/10-7/12 |
824LV, Party Distribution Not Provided |
Biden 48, Trump 42 |
Repeat |
|
| Political Ref's Take on the above poll |
Neither party distribution or voter ratios within those parties is provided. Adjustment not possible. Excluded. |
Adjustment not possible. Excluded. |
|
|
| PPP |
6/26-6/27 |
1237RV, 36D/31I/33R |
Biden 50, Trump 44 |
Repeat |
|
| Political Ref's Take on the above poll |
The D+3 sample under-samples Democrats. Michigan is tricky because when you push leaners to pick a side the state looks more Republican. I do think that Michigan should end up with about 40% of voters identifying Democrats and 29% Independent and 31% Republican in terms of actual registered voters. Adjusting to 40D/29I/31R. The voter ratios within parties is not provided but can be inferred. Biden had a +3 voter turnout advantage and still won by 6. So he likely won Independents and more Republicans than Trump won Independents and Democrats. For calculation purposes only, I will assume each candidate won his party 90-5 and Biden won Independents 17-14 or 55% to 45%. Reallocating these voter ratios to the more likely results, Biden receives 50.3 to Trump 40.4. |
Biden 50.3, Trump 40.4 |
|
Repeat |
| Change Research |
6/26-6/28 |
Undefined subset of 3729LV, Party Distribution Unavailable |
Biden 48, Trump 43 |
Repeat |
|
| Political Ref's Take on the above poll |
Party distribution and voter ratios within parties unavailable. Adjustment not possible. |
Adjustment not possible |
|
|
| NYT/Sienna College |
6/8-6/17 |
610RV, 31D/37I/25R |
Biden 47, Trump 36 |
>1 month |
|
| Political Ref's Take on the above poll |
There is a strong chance that Sienna failed to pick up some of the Trump vote among Independents as noted by other poll analysts. The results among Independents are far out of step with other pollsters like YouGov showing a dead heat in the group. Also, this poll includes 18% of Independents, 4% of Republicans and 7% of Democrats who said they are only somewhat likely to vote or not at all likely to vote. These voters should not be included in a poll and pollsters will exclude these respondents when filtering for likely voters. Pollsters know that inclusion of these respondents changes the numbers substantially, so why include them? Not only will these voters not vote, but many voters who self-report as likely to vote, and even some who say they are certain to vote, will also not vote. There are ways of screening out these respondents but pollsters claim it's too early to do this. If that's the case then it's too early to take polls seriously but the media reports them nonstop with major headlines. Bottom line, this category of somewhat likely to vote or will not vote at all is low hanging fruit for a pollster seeking likely voters (accuracy). I will consider this poll's results once it imposes a likely voter screen. The results are too out of the mainstream to ignore the NYT and Sienna's refusal to impose a likely voter screen. Excluded from this average. |
Excluded from our average |
|
|
| Trafalgar Group |
6/16-6/18 |
1101LV, Party Distribution Unavailable |
Biden 46.2, Trump 45.3 |
x |
|
| Political Ref's Take on the above poll |
Neither party distribution or Biden/Trump vote ratios within the parties are provided, so no adjustment is possible. |
Excluded |
|
|
| Change Research |
6/12-6/14 |
Undefined subset of 2408LV, Party Distribution Unavailable |
Biden 47, Trump 45 |
Repeat |
|
| American Greatness/TIPP |
6/9-6/12 |
907RV, 37D/29I/31Rep |
Biden 50, Trump 37 |
>1 Month |
|
| Political Ref's Take on the above poll |
The Biden/Trump vote ratios of each party are not provided and this poll includes many registered votes who will not vote making it difficult to infer voter ratios, so no adjustment is possible. Excluded from our average. |
Excluded from our average |
|
|
| Change Research |
5/29-5/31 |
Undefined subset of 3958LV, Party Distribution Unavailable |
Biden 48, Trump 46 |
Repeat |
|
| PPP |
5/29-5/30 |
1582RV, 39D/31I/30R |
Biden 50, Trump 44 |
>1month |
|
| Political Ref's Take on the above poll |
We see the sample at about the right place, 37-40% Democrat and 30-31% Republican. No adjustment necessary. 2016 exit polls of Michigan showed a party distribution of 40D/29I/31R. Also, see here. |
No adjustment necessary |
|
*>1month but included for avg |
| PPP |
5/18-5/19 |
1234RV, 35D/34I/31R |
Biden 51, Trump 45 |
Repeat |
|
| Political Ref's Take on the above poll |
When pollsters do not push leaners to pick a partisan lean, it is quite difficult to make adjustments. Had the lean question been asked, the large Independent contingent of 34% would have likely broken to Dems, putting the sample at about the right place, 37-40% Democrat and 30-31% Republican. No adjustment necessary. |
No adjustment necessary |
|
Repeat |
| Crooked/Change Research |
5/11-5/17 |
3070LV, Party distribution 37D/32I/31R |
Biden 49, Trump 46 |
Repeat |
|
| Political Ref's Take on the above poll |
The partisan distribution of 37D/32I/31R is slightly better for Trump than the 2016 exit polls showed. 2016 exit polls of Michigan showed a party distribution of 40D/29I/31R. Also, see here. But the exit polls also predicted a Clinton win while Trump actually won, so they were too favorable to Hillary. Because the 2016 exit polls were obviously too favorable to Hillary, a distribution of +6 Dems that this poll uses instead of +9 Dems which the 2016 exit polls found, seems reasonable. No adjustment necessary. |
No adjustment necessary |
|
>1month |
| Redfield & Wilton |
5/10-5/14 |
970LV, Party distribution unavailable |
Biden 47, Trump 39 |
>1 month |
|
| Political Ref's Take on the above poll |
This poll uses a questionable method of determining who is a likely voter. Rather than eliminate the vote of those stating they are leaning against voting or those aren't sure if they will vote, their votes are included but weighted down. So if someone says they are leaning towards not voting, that person's vote is still counted but weighted down by 80%. This method likely inflates the Democrat share of the vote by a point or two. |
Biden 46, Trump 40 |
|
>1 month |
| Michigan Statewide (Hodas & Assoc) |
5/1-5/5 |
600 LV, 30.7D/39I/30.3R |
Biden 50.3, Trump 41.5 |
>1month |
|
| Political Ref's Take on the above poll |
2016 exit polls of Michigan showed a party distribution of 40D/29I/31R. Also, see here. This differs from the Hodas & Assoc distribution, but it's probably because they pushed leaners to pick a side in the 2016 exit poll. If you assume the parties vote for their respective candidates in the Hodas & Assoc poll, and assume Biden wins Independents by 10 to 20%, as the 2016 exit poll suggests would happen if partisans go home, it puts Biden up 4 to 8 points. No adjustment necessary. |
No adjustment necessary |
|
>1 month |
| 2018 Exit Polls - 42D/15I/43R (Source 1, Source 2, Source 3, Source 4) if link is dead, request backup copy) |
To see results of 2016 Michigan polls below, click here
Best 2016 Michigan Poll: Trafalgar Group
Polls that got Michigan right: Univ. of New Hampshire, Alliance/ESA, UPI/CVoter, Survey Monkey, CCES/YouGov,
Polls that got Michigan wrong: Gravis, Boston Globe/Suffolk, ARG, UMASS Lowell, WBUR/MassInc, Inside Sources |


