|
 |
 |
|
PENNSYLVANIA |
| |
|
|
|
PENNSYLVANIA |
POLLSTERS: Biden +2.7, Biden 49.4, Trump 46.7
REF'S AVG: Trump +0.6, Biden 47.7, Trump 48.3 |
| RETURN TO ALL BATTLEGROUND STATES |
| Ref's Current Estimate of Turnout: 45D/8I/46R. This is based on my model, which you can see in my YouTube videos. |
| Explanation of Decision: The most reliable model I have estimates that in the end more Republicans will vote than Democrats, mainly because Democrats will not vote on election day in nearly the same percentage as Republicans because of Covid fears. This would be disastrous for the Democrats. The model most favorable to the Democrats suggests a voter turnout of 47D/10I/43R. If they hit this, it will be closer but Biden will have the edge. But I think we are much more likely to see close to even turnout between the parties and a Trump win. The expanded time to receive ballots will actually help Trump. Republicans have been much slower returning ballots and will likely have more late comers. The Democrats mail vote is already out. They were very early. My model has shown me Dem turnout will be down and GOP turnout up on election day. This is key to my projection. |
| 2016 Exit Poll - 42D/20I/39R without leaners (PDF) - 27Lib/40Mod/33Con |
| 2018 Exit Poll - 44D/11I/45R with leaners (PDF) |
| Pollsters' Averages Chart |
Political Ref's Averages Chart |
|
|
|
| POLL RESULT SUMMARY (SEE FULL RESULTS & EXPLANATIONS BELOW) |
| Poll |
Date |
Sample + Party Distribution |
Result |
Pollster Avg |
Ref's Avg |
| Susquehanna Polling |
11/1-11/2 |
499LV, 46D/14I/40R |
Biden 48.4, Trump 49.2 |
x |
|
| Political Ref's Take on the above poll |
I would normally adjust this based on party ID, but I'm leaving it to be cautious. |
Included |
|
x |
| Rasmussen Reports |
10/31-11/1 |
800LV, Behind pay wall |
Biden 50, Trump 47 |
x |
|
| Political Ref's Take on the above poll |
Using internals behind the pay wall, I did my normal adjustment and resulted in the following. Biden 47.3, Trump 47.4 |
Biden 47.3, Trump 47.4 |
|
x |
| *Monmouth Univ |
10/28-11/1 |
502RV, 47D/14I/39R |
Biden 50, Trump 45 |
x |
|
| Political Ref's Take on the above poll |
Data: Biden 90-8, 53-35I, 92-5. Adjusting to 45D/8I/46R. Biden receives 47.0 to Trump 48.7. |
Biden 47.0, Trump 48.7 |
|
x |
| *Frederick Polls |
10/30-10/31 |
879LV, 46D/12I/42R |
Biden 52, Trump 48 |
x |
|
| Political Ref's Take on the above poll |
Adjusting to 45D/8I/46R. Data: Biden 92-8, 56-44I, Trump 91-9. Adjusted: Biden 48.5 to 47.5 (Allocated to 97) |
Biden 48.5, Trump 47.5 |
|
x |
| *AtlasIntel |
10/29-10/30 |
672LV, 36D/28I/36R |
Biden 48.5, Trump 49.6 |
x |
|
| Political Ref's Take on the above poll |
Party distribution is hard to judge because so many I's are left. |
Included |
|
x |
| *Muhlenberg College |
10/23-10/28 |
419LV, 47D/10I/42R |
Biden 49, Trump 44 |
x |
|
| Political Ref's Take on the above poll |
D+5 is too high. Will assume 45D/9I/46R. Voter ratios are inferred, Biden up 5 w/ 5pt partisan adv. Assuming even across party, Biden 85-12 D's, 45-45 I's, Trump 85-12R's. Adjusted Biden receives 47.8 to Trump 48.6. |
Biden 47.8, Trump 48.6 |
|
x |
| RMG Research |
10/25-10/27 |
800LV, Party distribution not provided |
Biden 51, Trump 45 |
x |
|
| Political Ref's Take on the above poll |
I believe it will be a heavy GOP turnout so I accept RMG's heavy R turnout model. |
Biden 49, Trump 47 |
|
x |
| Franklin and Marshall |
10/19-10/25 |
558LV, 48D/11I/41R |
Biden 50, Trump 44 |
x |
|
| Political Ref's Take on the above poll |
D+7 too high. Will assume 46D/11I/45R. Biden leads by 6 w/ +8D turnout, so Trump +2 across party. Ratios inferred. Biden 87-6 D/s, Trump 48-45 I's, Trump 89-6 R's. Ratios applies, Biden receives 47.7 to Trump 48.1. |
Biden 47.7, Trump 48.1 |
|
x |
| Inisder Advantage |
10/25 |
400LV, 45D/8I/43.5R |
Biden 45.5, Trump 48.4 |
x |
|
| Political Ref's Take on the above poll |
The party distribution matches what I expect. According to the data, Biden won D's 80-16, I's 59-22 and Trump won R's 87-11. |
Included |
|
x |
| FULL POLL RESULTS AND EXPLANATIONS OF ADJUSTMENTS |
| Poll |
Date |
Sample + Party Distribution |
Result |
Pollster Avg |
Ref's Avg |
| RMG Research |
10/25-10/27 |
800LV, Party distribution not provided |
Biden 51, Trump 45 |
x |
|
| Political Ref's Take on the above poll |
I believe it will be a heavy GOP turnout so I accept RMG's heavy R turnout model. |
Biden 49, Trump 47 |
|
x |
| Franklin and Marshall |
10/19-10/25 |
558LV, 48D/11I/41R |
Biden 50, Trump 44 |
x |
|
| Political Ref's Take on the above poll |
D+8 too high. Will assume 46D/11I/45R. Biden leads by 6 w/ +8D turnout, so Trump +2 across party. Ratios inferred. Biden 87-6 D/s, Trump 48-45 I's, Trump 89-6 R's. Ratios applies, Biden receives 47.7 to Trump 48.1. |
Biden 47.7, Trump 48.1 |
|
x |
| Survey Monkey |
9/30-10/27 |
10250LV, Not provided |
Biden 52, Trump 46 |
x |
|
| Political Ref's Take on the above poll |
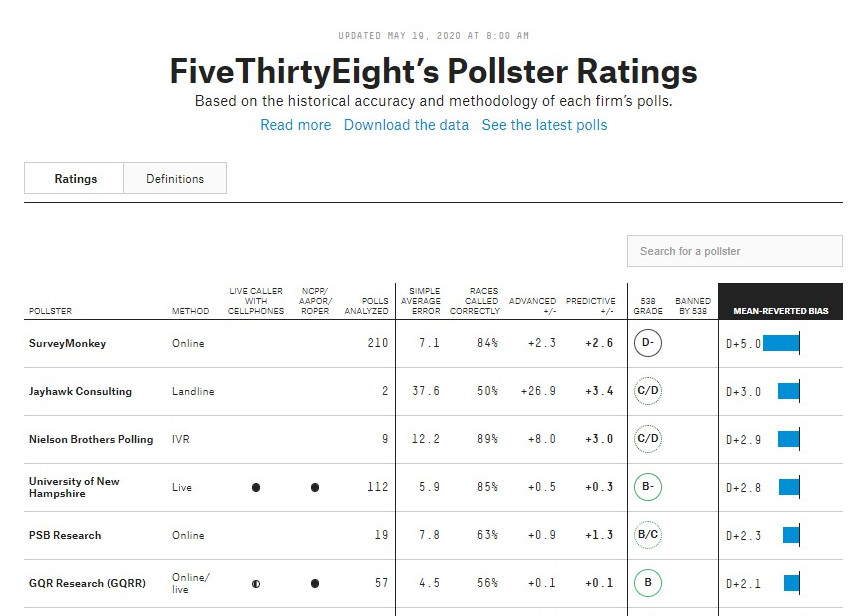
This pollster has the most pro-Democrat mean-reverted bias on fivethirtyeight.com, +5.0 more favorable to Dems. (Screenshot, Direct Link). This is also an online only poll, which favor Democrats on average, so an adjustment will be applied. See explanation of the online adjustment. |
Biden 50.5, Trump 47.5 |
|
x |
| Inisder Advantage |
10/25 |
400LV, 45D/8I/43.5R |
Biden 45.5, Trump 48.4 |
x |
|
| Political Ref's Take on the above poll |
The party distribution matches what I expect. According to the data, Biden won D's 80-16, I's 59-22 and Trump won R's 87-11. |
Included |
|
x |
| Univ of Wisconsin-YouGov |
10/13-10/21 |
669LV, Party distribution not provided |
Biden 52, Trump 44 |
x |
|
| Political Ref's Take on the above poll |
Neither party distribution or voter ratios provided. |
Excluded |
|
|
| Gravis Marketing |
|
41D/23I/36R |
Biden 51, Trump 44 |
x |
|
| Political Ref's Take on the above poll |
D+5 assumes too big a partisan advantage for D's. Adjusting to 42D/16I/41R. Biden has a 7-point lead with a 5-partisan advantage, suggesting he did only moderately better across party. We know he won I's 55-35, gaining 4.5 points of his 7-point lead there. Will assume he won D's 85-12 and Trump won R's 87-10. Applying these ratios to the more likely turnout, Biden receives 48.6 to Trump 46.3. |
Biden 48.6, Trump 46.3 |
|
x |
| Muhlenberg College |
10/13-10/20 |
416LV, 47D/10I/41R |
Biden 51, Trump 44 |
x |
|
| Political Ref's Take on the above poll |
The D+6 sample oversamples Democrats. Will adjust to D+1, or 45D/10I/44R. Voter ratios are not provided but can be inferred. Biden has a 7-point lead with a 6-point partisan advantage, suggesting he did very slightly better across party. Assuming Biden won D's 90-7, I's 48-45 and Trump won R's 88-8. Biden receives 45.3 to Trump 46.4. |
Biden 45.3, Trump 46.4 |
|
x |
| Fox News |
10/7-10/20 |
1045LV, 50D/5I/45R |
Biden 50, Trump 45 |
x |
|
| Political Ref's Take on the above poll |
The D+5 sample oversamples Democrats. Will adjust to 45D/5I/44R. According to the data, Biden won D's 89-8, I's split and Trump won R's 89-9. Applying the ratios to the more likely turnout, Biden receives 46.5 to Trump 45.3. |
Biden 46.5, Trump 45.3 |
|
x |
| Suffolk Univ |
10/15-10/19 |
500LV, 45D/12I/39R |
Biden 49, Trump 42 |
|
|
| Political Ref's Take on the above poll |
The D+6 samples oversamples Dems. Will adjust to 45D/6I/44R. Voter ratios can be inferred. Assuming Biden won D's 90-7, I's split and Trump won R's 90-7. Applying voter ratios to the more likely turnout, Biden receives 46.6 to Trump 45.8. |
Biden 46.6, Trump 45.8 |
|
x |
| CNN/SSRS |
10/15-10/20 |
843LV (Assuming 91% turnout among RV's, very far from reality), Party distribution not provided for LV |
Biden 53, Trump 43 |
x |
|
| Political Ref's Take on the above poll |
Neither party distribution or voter ratios are provided. |
Excluded |
|
|
| Quinnipiac Univ |
10/16-10/19 |
1241LV, 40D/21I/33R |
Biden 51, Trump 43 |
x |
|
| Political Ref's Take on the above poll |
The D+7 sample oversamples Dems. Adjusting to 42D/16I/41R. This is among "self-identified" likely voters, which means it's a RV poll. An RV filter will apply the D and I columns. D's only turned out at a rate of 61% in 2016. According to the data Biden won D's 93-5 (90-7), I's 54-41 (37-28.3) and Trump won R's 90-7. Biden receives 46.6 to Trump 44.4. |
Biden 46.6, Trump 44.4 |
|
x |
| Rasmussen Reports |
10/18-10/19 |
800LV, Party distribution not provided. |
Biden 50, Trump 47 |
x |
|
| Political Ref's Take on the above poll |
Neither party distribution or voter ratios are provided. |
Excluded |
|
|
| Trafalgar Group |
10/14-10/16 |
1051LV, Party distribution not provided |
Biden 47.5, Trump 46.4 |
x |
|
| Political Ref's Take on the above poll |
This poll assumed more women than voted in 2016 which favors Dems, racial percentages matched 2016, age assumptions matched. |
Included |
|
x |
| Ipsos |
10/13-10/19 |
663LV, 43D/10I/41R |
Biden 49, Trump 45 |
x |
|
| Political Ref's Take on the above poll |
The D+2 oversamples Democrats. This is an online only poll, which favor Democrats on average, so an adjustment will be applied. See explanation of the online adjustment. |
Biden 47.5, Trump 46.5 |
|
x |
| HarrisX |
10/12-10/15 |
992LV, Party distribution not available |
Biden 51, Trump 46 |
x |
|
| Political Ref's Take on the above poll |
Neither party distribution or voter ratios are available. |
Excluded |
|
|
| Insider Advantage |
10/12-10/13 |
400LV, Party distribution not available |
Biden 46, Trump 43 |
x |
|
| Political Ref's Take on the above poll |
Neither party distribution or voter ratios are available. |
Excluded |
|
|
| Survey Monkey |
9/15-10/12 |
6613LV, Error in reporting |
Biden 52, Trump 47 |
x |
|
| Political Ref's Take on the above poll |
This pollster has the most pro-Democrat mean-reverted bias on fivethirtyeight.com, +5.0 more favorable to Dems. (Screenshot, Direct Link). This is also an online only poll, which favor Democrats on average, so an adjustment will be applied. See explanation of the online adjustment. |
Biden 50.5, Trump 48.5 |
|
x |
| Whitman Insight Strategies |
10/5-10/9 |
517LV, 44D/15I/42R |
Biden 51, Trump 46 |
x |
|
| Political Ref's Take on the above poll |
The party distribution is very close to my assumption. This is an online only poll, which favor Democrats on average, so an adjustment will be applied. See explanation of the online adjustment. |
Biden 49.5, Trump 47.5 |
|
x |
| Reuters/Ipsos |
10/6-10/11 |
622LV, Party distribution not provided |
Biden 51, Trump 45 |
x |
|
| Political Ref's Take on the above poll |
Neither party distribution or voter ratios are provided. This is an online only poll, which favor Democrats on average, so an adjustment will be applied. See explanation of the online adjustment. |
Biden 49.0, Trump 47.0 |
|
x |
| Baldwin Wallace Univ Great Lakes polls |
9/30-10/8 |
1140LV (Within 3.1% margin of error), 45D/15I/40R |
Biden 49.6, Trump 44.5 |
x |
|
| Political Ref's Take on the above poll |
The D+5 sample oversampled Dems. Adjusting to 42D/16I/41R. According to the data, Biden wins D's 90-7, I's split 40-38 and Trump wins R's 88-8. Applying these voter ratios, Biden receives 47.5 to Trump 45.1. An online poll adjustment is not made when another adjustment is made. |
Biden 47.5, Trump 45.1 |
|
x |
| Emerson College |
10/4-10/5 |
48D/14I/38R |
Biden 50.1, Trump 45.4 |
x |
|
| Political Ref's Take on the above poll |
The D+10 sample oversamples Democrats. Will adjust to 42D/16I/41R. Voter ratios were not provided but can be inferred. Biden had a 10-point partisan advantage and a 4.5 point lead, suggesting Trump did 5.5 points (16.5% across 3 parties) better with Independents and Democrats than Biden did with Independents and Republicans. Will assume Biden won D's 90-8, Trump won I's 50-40 and R's 92-4. Applying these voter ratios to the more likely turnout Biden receives 45.8 to Trump 49.1. |
Biden 45.8, Trump 49.1 |
|
x |
| Monmouth Univ |
9/30-10/4 |
500LV, 46D/14I/40R |
Biden 53, Trump 45 |
x |
|
| Political Ref's Take on the above poll |
The way Monmouth reported its poll, the party distribution seems likely to fluctuate through each of its turnout models, so I have to use registered voters. D+6 is too high in Pennsylvania, will adjust to D+1, or 42D/16I/41R. Using this sample, Biden leads 54-42 among registered voters. Voter ratios are not provided but can be inferred. Biden leads by 12 with a partisan advantage of 6, suggesting he did 6 points (18% across 3 parties) better with Republicans and Independents than Trump did with Democrats and Independents. Assuming Biden won D's 93-3, I's 50-38 and Trump won R's 90-6. Applying these ratios to the more likely turnout of 42D/16I/41R, Biden receives 49.5 to Trump 44.2. |
Biden 49.5, Trump 44.2 |
|
x |
| Ipsos |
9/29-10/5 |
605LV, Party distribution not available |
Biden 50, Trump 45 |
x |
|
| Political Ref's Take on the above poll |
Neither the party distribution or voter ratios are provided. |
Excluded |
|
|
| YouGov |
9/30-10/2 |
1187RV, 41D/20I/38R |
Biden 51, Trump 44 |
x |
|
| Political Ref's Take on the above poll |
This poll slightly oversamples Dems, will adjust to D+1, or 42D/16I/41R. See above. Will also apply a registered voter screen to the I column. This is not a likely voter poll although it purports to be. It polled 1202 registered voters and identified 1187 as likely voters. This would be a 99% turnout rate among registered voters, which is nowhere close to accurate. According to the poll data, Biden won D's 90-6, I's 50-40 (33-27.3) and Trump won R's 87-8. After registered voter screen is applied to I's, it adjusts to 33-27.3. Applying the voter ratios to the more likely turnout, Biden receives 46.4 to Trump 42.6. |
Biden 46.4, Trump 42.6 |
|
x |
| ABC/Washington Post |
9/21-9/26 |
568LV, 39D/21I/34R |
Biden 54, Trump 45 |
x |
|
| Political Ref's Take on the above poll |
This poll assumes an 81% turnout among all registered voters, a high but realistic number. This number also doesn't suggest that turnout will exceed 2016, when 6.2 million of a possible 7.5 millions registered voters showed up to vote in Pennsylvania (83%). So the Post's own likely voter model is hinting that turnout will match 2016 when we saw a D+3 turnout after Republicans have closed the registration gap by 150,000 votes over the last four years, or by 2%. The D+5 sample oversamples Democrats. Adjusting to D+1, or 42D/16I/41R. According to the data, Biden holds a 9-point lead while having a 5-point partisan turnout advantage, suggesting he did 4 points (12%) better with Independents and Republicans than Trump did with Independents and Democrats. Assuming Biden won D's 92-3, I's 48-42 and Trump won R's 88-5. Applying these voter ratios to the more likely turnout, Biden receives 48.4 to Trump 44.1. |
Biden 48.4, Trump 44.1 |
|
x |
| New York Times/Sienna |
9/25-9/27 |
711LV, 37D/27I/33R |
Biden 49, Trump 40 |
x |
|
| Political Ref's Take on the above poll |
Unlike every other pollster, this pollster fails to tell us how many registered voters it polled to reach 711 likely voters. This is essential information in determining the validity of a poll. Because this poll consistently fails to reveal this information one can only conclude that they are hiding it, which violates the American Association for Public Opinion Research Transparency Initiative standards. I adopt this standard for my averages and will not include polls that violate it. I will include it in the pollster average because the point of that average is to honestly track what pollsters are telling America, which is often deceptive. |
Excluded |
|
|
| Federalist/TIPP |
9/24-9/26 |
909RV, 44D/17I/39R; 774LV, party distribution not provided |
RV: Biden 49, Trump 44 - LV: Biden 50, Trump 45 |
x |
|
| Political Ref's take on the above poll |
Party distribution is not provided for likely voters, which of course represents the most important data in the poll because everyone cites the likely vote number and the voter turnout model determines the likely voter model results. We can, however, analyze this poll because the likely and registered voter model results match. While not a guarantee that the parties in the registered voter sample voted in the same ratios as they did in the likely voter sample, its gives us a good approximation. According to the registered voter poll data, Biden won D's 78-10, I's 48-34 and Trump won R's 77-5. Assuming a D+1 turnout of 42D/16I/41R, Biden receives 42.5 to Trump 41.2. |
Biden 42.5, Trump 41.2 |
|
x |
| Trafalgar Group |
9/18-9/21 |
1006LV, Party distribution not provided |
Biden 48, Trump 46 |
x |
|
| Political Ref's take on the above poll |
This was the most accurate poll in Pennsylvania in 2016 |
Included |
|
x |
| *Fox News |
9/20-9/23 |
856LV, 50D/8I/42R |
Biden 51, Trump 44 |
x |
|
| Political Ref's take on the above poll |
The D+8 sample oversamples Democrats. Will adjust to the more likely D+1 leaners voter turnout assumption, or 45D/11I/44R. According to the poll data, Biden won D's 92-5, and Trump won I's 26-52 and R's 89-8. The pollster did not provide the voter ratio for Independents, we had to calculate it. Applying these voter ratios to the more likely turnout, Biden receives 47.8 to Trump 47.1. |
Biden 47.8, Trump 47.1 |
|
x |
| YouGov |
9/10-9/21 |
642LV, D+8 for a three-state sample (PA, MI, WI) |
Biden 50, Trump 46 |
|
|
| Political Ref's take on the above poll |
Neither party distribution nor voter ratios of those parties is provided. |
Excluded |
|
|
| Baldwin Wallace Univ (Great Lakes Poll) |
9/8-9/22 |
1012LV, 43D/16I/42R |
Biden 47.3, Trump 44.6 |
|
|
| Political Ref's take on the above poll |
The party distribution reflects slightly higher Republican representation, which is consistent with the registration shift in the state. |
Included |
|
|
| Survey Monkey |
June-Sept 2020 |
18,021RV, Party distribution unavailable |
Biden 51, Trump 46 |
|
|
| Political Ref's take on the above poll |
The party distribution or voter ratios are not available, but a registered voter screen can be applied. Biden adjusts to 34 and Trump to 33.3. Apply the 34/33.3 ratio to the 97% of respondents choosing Biden or Trump, Biden receives 49.0 to Trump 48.0. |
Biden 49.0, Trump 48.0 |
|
|
| YouGov |
9/10-9/21 |
642LV, D+8 for a three-state sample (PA, MI, WI) |
Biden 49, Trump 45 |
|
|
| Political Ref's take on the above poll |
Neither party distribution nor voter ratios of those parties is provided. |
Excluded |
|
|
| Franklin & Marshall |
9/14-9/20 |
625RV, 47D/13I/40R |
Biden 49, Trump 40 |
|
|
| Political Ref's take on the above poll |
Biden had a +7 partisan turnout advantage and leads by 9, so he must have performed slightly better (2 points or 6%) among Independents and Republicans than Trump did among Independents and Democrats. Voter ratios are not provided but can be inferred. Assuming Biden won D's 92-5, I's 48-45 and Trump won R's 89-5. Applying these ratios to the more likely turnout of 43D/16I/42R, Biden receives 48.9 to Trump 46.7. |
Biden 48.9, Trump 46.7 |
|
|
| Ipsos |
9/11-9/16 |
611LV, 46D/7I/40R |
Biden 49, Trump 46 |
|
|
| Political Ref's Take on the above poll |
The D+6 sample oversamples Democrats. Will adjust to a D+3, or 45D/7I/42R. Voter ratios are not provided but can be inferred. Biden had a +6 partisan advantage but only leads by 3, so we can assume Trump did 3 points (9%) better with Democrats and Independents than Biden did with Republicans and Independents. Will assume Trump won I's 4-3, Biden won D's 87-8 and Trump won R's 90-5. Applying these voter ratios to the more likely voter turnout, Biden receives 44.3 to Trump 45.4. |
Biden 44.3, Trump 45.4 |
|
|
| Trafalgar Group |
9/15-9/17 |
1006LV, Party distribution not provided |
Biden 47, Trump 45 |
|
|
| Political Ref's Take on the above poll |
Neither party distribution nor voter ratios of those parties is provided. |
Excluded |
|
|
| Climate Nexus |
9/8-9/11 |
659RV, 42D/17I/39R |
Biden 48, Trump 43 |
|
|
| Political Ref's Take on the above poll |
The party distribution is very good. This is registered voter poll, so a registered voter poll will be applied. Biden adjusts to 31 and Trump adjusts to 30.3, apply the 31/30.3 ratio to the 91% of respondents who chose Biden or Trump, Biden receives 46.0 to Trump 45.0. |
Biden 46.0, Trump 45.0 |
|
|
| Benenson Strategy Group/GS Strategy Group |
8/28-9/8 |
1600LV, Party distribution not provided |
Biden 49, Trump 46 |
|
|
| Freedom Window's Take on the above poll |
In one of the oldest states in the nation, Biden leads narrowly among those fifty and older. This group will likely decide the state. |
Included |
|
|
| TargetSmart |
9/3-9/6 |
835LV, 40D/26I/33R |
Biden 51, Trump 43 |
|
|
| Freedom Window's Take on the above poll |
The D+7 sample oversamples Democrats. Will adjust to the more likely D+3, or 42D/20I/39R. Vote ratios are not provided but can be inferred. Biden had a +7 partisan advantage and leads by 8, so he must have done slightly better with Independents than Trump. Will assume Biden won Independents 13-12, or 49-46%. Assuming each candidate won his party 90-5, with the more likely voter turnout Biden receives 49.6 to Trump 46.4. |
Biden 49.6, Trump 46.4 |
|
|
| Marist College |
8/31-9/7 |
771LV, 48D/12I/40R |
Biden 53, Trump 44 |
|
|
| Freedom Window's Take on the above poll |
The D+8 sample oversampled Democrats. Will adjust to the more likely 45D/12I/42R. According to the poll data, Biden won D's 90-7, I's 57-35 and Trump won R's 91-8. Applying these voter ratios to the more likely turnout, Biden receives 50.8 to Trump 41.4. |
Biden 50.8, Trump 41.4 |
|
|
| Morning Consult |
8/29-9/7 |
2227LV, Partisan distribution not provided |
Biden 50, Trump 45 |
|
|
| Political Ref's Take on the above poll |
Neither party distribution nor voter ratios of those parties is provided. |
Excluded |
|
|
| Change Research |
9/4-9/6 |
829LV, Party distribution not provided |
Biden 50, Trump 46 |
|
|
| Political Ref's Take on the above poll |
Neither party distribution nor voter ratios of those parties is provided. |
Excluded |
|
|
| Susquehanna Polling and Research |
8/26-9/4 |
498LV, 43D/16I/39R |
Biden 44, Trump 42 |
|
|
| Political Ref's Take on the above poll |
The party distribution slightly undersampled Independents and possibly Republicans, especially considering that Republicans have been gaining on Democrats quickly in terms of registrations. Will adjust to the more likely 42D/20I/39R. Voter ratios within the parties was not provided but can be inferred. Biden a +4 partisan advantage but leads only by 2, suggesting Trump did 2 points (6%) better among Independents and Democrats than Biden did with Independents and Republicans. Will assume Biden won D's 88-7, Trump won I's 48-45 and R's 90-6. Applying these ratios to the more likely turnout, Biden receives 48.3 to Trump 47.6. The poll found an ideological distribution of 13Lib/30Mod/30Con. This sampling undersampled all three groups compared to the 2016 exit polls, which found 27Lib/40Mod/33Con. The pollster probably didn't push leaners to choose. Nonetheless, we can probably conclude that this looks like a much less liberal electorate than 2016, a good sign for Trump. |
Biden 48.3, Trump 47.6 |
|
|
| Rasmussen Reports |
8/25-8/27 |
1000LV, Party distribution not provided |
Biden 46, Trump 46 |
|
|
| Political Ref's Take on the above poll |
Neither party distribution or voter ratios within those parties are provided. |
Excluded |
|
|
| Monmouth Univ |
8/28-8/31 |
400LV, 48D/14I/38R |
Biden 48, Trump 47 |
|
|
| Political Ref's Take on the above poll |
The D+10 sample oversamples Democrats, but the likely voter model corrected for this. According to the poll data, Biden won D's 88-6, I's split 45-45 and Trump won R's 90-6. No adjustment necessary. |
Included |
|
|
| Morning Consult |
8/21-8/30 |
2158"LV," Party distribution not provided |
Biden 49, Trump 45 |
|
|
| Political Ref's Take on the above poll |
Neither party distribution nor voter ratios of those parties is provided. |
Excluded |
|
|
| Change Research |
8/21-8/23 |
984LV, Party distribution not provided |
Biden 49, Trump 46 |
|
|
| Political Ref's Take on the above poll |
Neither party distribution nor voter ratios of those parties is provided. |
Excluded |
|
|
| Franklin & Marshall |
8/17-8/23 |
47D/12I/41R |
Biden 49, Trump 42 |
|
|
| Political Ref's Take on the above poll |
The D+6 sample oversamples Democrats. Will adjust to the more likely D+3 sample, or 42D/20I/39R, from 2016. This is a registered voter poll. The partisan distortion (D/R) registered voter polls present has been mostly dealt with due to the voter turnout assumption adjustment, so the registered voter adjustment will only apply to Independents. The voter ratios are not provided but can be inferred. Biden had a 7-point lead but had a 6-point partisan turnout advantage. This suggests Biden did slightly better with Independents than Trump, by about 1 point. Assuming Biden won Independents 6-5 with 1 point not voting for Trump or Biden, or 50-42% with Independents. Extrapolating to the 20% Independent sample, Biden leads 10-8.4 with 1.6 voting third party. Then we apply the registered voter screen, where Biden loses 3.4 (55% of the unlikely to vote Independents) and Trump loses 2.5 (41% of the unlikely to vote Independents), resulting in an Independent sample voting 6.6 for Biden and 5.9 for Trump. Assuming each candidate won his party 90-5, Biden receives 46.4 to Trump 43.1. |
Biden 46.4, Trump 43.1 |
|
|
| Civiqs |
8/13-8/17 |
617RV, 37D/30I/33R |
Biden 51, Trump 44 |
|
|
| Political Ref's Take on the above poll |
The party distribution substantially over-represents Independents and slightly undersamples D's and R's. Will adjust to the much more likely 42D/20I/39R. According to the poll data, Biden won D's 91-5, I's 49-44 and Trump won R's 88-8. First I will adjust for voter turnout assumption, applying the voter ratios to the much more likely 42D/20I/39R turnout, where Biden receives 51.1 to Trump 45.2. Now, adjusting with the registered voter screen where 31% of respondents fail to show up and actually vote 55% of which are D leaning and 41% are R leaning. Adjusted, Biden receives 34.1 to Trump 32.9. Applying the 34.1/32.9 ratio to the 95% of respondents who chose Biden or Trump, Biden receives 48.4 to Trump 46.6. |
Biden 48.4, Trump 46.6 |
|
|
| Muhlenberg College |
8/11-8/17 |
416LV, 47D/12I/39R |
Biden 49, Trump 45 |
|
|
| Political Ref's Take on the above poll |
The D+8 sample oversamples Democrats. Will adjust to the much more likely D+3, or 42D/20I/39R. Voter ratios are not provided but can be inferred. Biden had a +8 partisan turnout assumption advantage but only leads by 4. Trump, therefore, likely performed better among Independents and Democrats than Biden performed among Independents and Republicans. Assuming Trump did 2 points better with D's than Biden did with R's and 2 points better with I's. Assuming Biden won D's 88-8, Trump won I's 50-42 and R's 90-4. Applying the voter ratios to the much more likely voter turnout assumption, Biden receives 46.9 to Trump 48.5. |
Biden 46.9, Trump 48.5 |
|
|
| Change Research |
8/7-8/9 |
456LV, D+4 across all battlegrounds, but party distribution for each state is not provided |
Biden 47, Trump 43 |
|
|
| Political Ref's Take on the above poll |
Neither voter turnout assumptions or voter ratios within the parties is provided. Impossible to verify credibility of the poll. |
Excluded |
|
|
| Emerson College |
8/8-8/10 |
843LV, 48D/14I/38R |
Biden 53, Trump 47 |
|
|
| Political Ref's Take on the above poll |
The D+10 sample heavily oversamples Democrats. Will adjust to the much more likely D+3, 42D/20I/39R. Voter ratios are not provided but can be inferred. Biden had a 10-point turnout advantage but leads by 6 points, suggesting Trump did better with Independents and Democrats than Biden did with Independents and Republicans. In reality, Trump likely won more Dems than Biden won R's, but for purposes of calculation I will assume the difference all came among Independents. Will assume Trump won Independents by 11-7, or 55% to 35%, with the rest voting third party. Will assume each candidate won his party 90-5. Applying the new voter ratios, Biden receives 46.8 to Trump 48.2. |
Biden 46.8, Trump 48.2 |
|
|
| CBS |
8/4-8/7 |
1211RV, 41D/22I/35R |
Biden 49, Trump 43 |
|
|
| Political Ref's Take on the above poll |
The D+6 sample oversamples Democrats. Will adjust to the more likely D+3, or 42D/20I/39R. According to the poll data, Biden won D's 90-4, I's 44-40 and Trump won R's 90-6. Will apply a registered voter screen to the Independent column, adjusted Biden 27 to Trump 27.3. Applying these ratios to the more likely voter turnout, Biden receives 45.5 to Trump 42.2. Remember, this a registered voter polls, which tend to inflate the Democratic turnout higher than actually manifests on election day. The margin is likely closer than even this adjusted result. |
Biden 45.5, Trump 42.2 |
|
|
| OnMessage Inc. |
8/2-8/4 |
400LV, Party distribution not provided |
Biden 50, Trump 46 |
|
|
| Political Ref's Take on the above poll |
Party distribution is not provided by voter ratios are. Biden won D's 94-5, I's split 46 Biden and 44 Trump, and Trump won R's 93-5. Applying these ratios to the like voter turnout of 42D/20I/39R, Biden receives 50.6 to Trump 47.2. |
Biden 50.6, Trump 47.2 |
|
|
| Univ. of Wisconsin |
7/27-8/6 |
742RV, Party distribution not provided |
Biden 50, Trump 41 |
|
|
| Political Ref's Take on the above poll |
The party distribution is not provided by the voter ratios are. According to the poll data, Biden won D's 90-5, I's split at 45 Biden to 41 Trump, and Trump won R's 88-6. A registered voter screen will be applied to the I column. After adjusting, I's vote 28.3-28.0 for Trump. Applying these ratios to the likely voter turnout of 42D/20I/39R, Biden receives 45.7 to Trump 42.1 |
Biden 45.7, Trump 42.1 |
|
|
| Zogby Analytics |
7/21-7/23 |
809LV, Party distribution unavailable |
Biden 44, Trump 43 |
|
|
| Political Ref's Take on the above poll |
Neither party distribution or voter ratios within those parties are available. Because of this, the credibility of the partisan assumptions cannot be verified. |
Excluded |
|
|
| Hodas & Assoc |
7/17-7/22 |
600LV, 41.2D/22.2I/36.5R |
Biden 51, Trump 45 |
|
|
| Political Ref's Take on the above poll |
The D+4.7 turnout assumption seems to oversample Democrats. Adjusting to the more likely 42D/20I/39R voter turnout. The voter ratios within the parties is not provided, but can be inferred. Biden had a +4.7 turnout advantage but is ahead by 6, suggesting he slightly outpaced Trump among Independents. Assuming Biden won I's 10-8.8 with 3 voting for a third party, or 45% to 40%. Assuming each candidate won his party 90-5, Biden receives 48.8 to Trump 45.2, |
Biden 48.8, Trump 45.2 |
|
|
| Franklin & Marshall College |
7/20-7/26 |
667RV, 48.5D/10.7I/40.6R |
Biden 49, Trump 40 |
|
|
| Political Ref's Take on the above poll |
The D+8 sample oversamples Democrats. Adjusting to the more likely D+3, or 42D/20I/39R. Voter ratios within parties are not provided, but can be inferred. Biden had a +8 turnout advantage and was up 9, so he must have done slightly better with Independents than Trump. Assuming Biden won Independents 5-4 with 2 voting other, or 45%-36% and each candidate won his party 90-5, and assuming the more likely turnout of 42D/20I/39R, Biden receives 48.8 to Trump 44.4. |
Biden 48.8, Trump 44.4 |
|
|
| Change Research |
7/24-7/26 |
382LV, Party distribution for the state not provided |
Biden 48, Trump 46 |
|
|
| Political Ref's Take on the above poll |
The party distribution for all six battleground states in the poll was 36D/30I/34R. This comes close to the turnout for all six states combined in 2016 according to the exit polls, which is 35.3D/31.2I/33.5R. I think these are there most credible battleground state polls by Change Research yet. Unfortunately, state specific information is required to assess the credibility of this polls, which is the purpose of the Freedom Window average. Full explanation below. |
Excluded |
|
|
| Gravis Marketing |
7/22-7/24 |
1006LV, 41D/23I/36R |
Biden 48, Trump 45 |
|
|
| Political Ref's Take on the above poll |
The D+5 sample oversamples Dems. Will adjust to D+3, 42D/20I/39R from 2016. Voter ratios within parties are not provided but can be inferred. Biden had a voter turnout advantage of 5 but leads by 3, so Trump must have done slightly better (2 points) with Independents and Democrats than Biden did with Republicans and Independents. Assuming Biden and Trump each won their party 90-5 and Trump won Independents 12.5-10.5 or 54%-46%, which did not happen but is a fiction that allows for a relatively accurate adjustment. Applying these voter ratios to the more likely voter turnout 42D/20I/39R, Biden receives 49.0 to Trump 48.0. |
Biden 49.0, Trump 48.0 |
|
|
| Fox News |
7/18-7/20 |
793RV, 48D/12I/40R |
Biden 50, Trump 39 |
|
|
| Political Ref's Take on the above poll |
The D+8 sample oversamples Democrats. Will adjust to the much more likely D+3 voter turnout from 2016, 45D/12I/42R. Biden won D's 88-5, I's 40-29 and Trump won R's 82-8. Applying these voter ratios to the more likely turnout of 45D/12I/42R, Biden receives 47.8 to Trump 40.2. It is important to note that this is a registered voter poll, which tend to favor Democrats in almost every case, although not every time. The margin is likely closer than even this adjusted result. |
Biden 47.8, Trump 40.2 |
|
|
| Spry Strategies |
7/15-7/20 |
700LV, 44D/13I/42R |
Biden 47, Trump 48 |
|
|
| Political Ref's Take on the above poll |
The D+2 sample nearly matches the 2016 D+3 voter turnout. No adjustment necessary. |
Included |
|
|
| Pulse Opinion Research (Rasmussen Reports) |
7/15-7/16 |
750LV, Party distribution not provided |
Biden 51, Trump 46 |
|
|
| Political Ref's Take on the above poll |
Party distribution & voter ratios of the vote within those parties is not provided. Neither adjustment or verification of the legitimacy of the voter turnout assumption is possible, therefore the poll result's reliability cannot be verified. For these reasons this poll result is excluded from our averages, but included only in the pollster averages above. |
Excluded |
|
|
| Change Research |
7/10-7/12 |
743LV, Party Distribution Not Provided |
Biden 50, Trump 42 |
|
|
| Political Ref's Take on the above poll |
Neither party distribution or voter ratios within those parties is provided. Adjustment not possible. Excluded. |
Adjustment not possible. Excluded. |
|
|
| Monmouth Univ |
7/9-7/13 |
401LV, Party Distribution of Likely Voters Not Reported |
Biden 51, Trump 44 |
|
|
| Political Ref's Take on the above poll |
The party distribution of registered voters is reported, but not likely voters. The likely voter model, based only on the description of the Monmouth poll article writer, not the data, seems to depict a turnout similar to 2016. For this reason the likely voter model is included in this average. |
Biden 51, Trump 44 |
|
|
| Trafalgar Group |
6/29-7/2 |
1062LV, Party Distribution not Provided |
Biden 48, Trump 43 |
|
|
| Political Ref's Take on the above poll |
Neither party distribution or voter ratios within the parties were provided. Adjustment not possible. |
Adjustment not possible |
|
|
| Change Research |
6/26-6/28 |
Undefined subset of 3729LV, Party Distribution Unavailable |
Biden 50, Trump 44 |
|
|
| Political Ref's Take on the above poll |
Party distribution and voter ratios within parties unavailable. Adjustment not possible. |
Adjustment not possible |
|
|
| Fox 43/Susquehanna Polling |
6/15-6/23 |
715LV, 49D/7I/42R |
Biden 46, Trump 41 |
|
|
| Political Ref's Take on the above poll |
This party distribution assumes that Democrats see a spike in turnout that has not occurred in either of the last two elections. This no doubt results from a feeble likely voter screen where only those who answered that their chances of voting were "poor" were excluded. The poll included everyone who said their chances were "good" or "fair." That is not a likely voter screen and we see results consistent with a registered voter poll. Also, considering Republicans outnumbered Democrats in PA in 2018 and GOP enthusiasm far outweighs Democratic enthusiasm this time, it is not clear why the pollster sees the state trending to a huge +7 Democratic advantage. Based on 2018 and the trajectory, it is much more likely that we see a return to the 2016 turnout. So I will assume a D+3 turnout of 46D/10I/43R. The Biden/Trump vote ratios within each party were not provided but can be inferred. Biden had a +7 voter turnout advantage but only leads by 5. So Trump must have won Independents or done better with Democrats than Biden did with Republicans. For purposes of calculation I will assume Trump made up 2 points with I's, winning them 4.5-2.5, or 64% to 36%. Of course Trump did not win Independents by this margin, but likely won a good number of Democrats and held onto more Republicans than Biden did Democrats, but for purposes of calculation we will just assume each candidate won his party 90-5 and Trump won I's 64-36. Extrapolating these ratios out to the more likely voter turnout of 46D/10I/43R, Biden receives 47.2 to Trump 47.4. |
Biden 47.2, Trump 47.4 |
|
|
| NYT/Sienna College |
6/8-6/16 |
651RV, 38D/26I/33R |
Biden 50, Trump 40 |
|
|
| Political Ref's Take on the above poll |
There is a strong chance that Sienna failed to pick up some of the Trump vote among Independents as noted by other poll analysts. The results among Independents are far out of step with other pollsters like YouGov showing a dead heat in the group. Also, this poll has a D+6 party distribution, higher than the more likely D+3 party distribution of 42D/20I/39R. This poll also includes 8% of Independents, 3% of Republicans and 5% of Democrats who said they are only somewhat likely to vote or not at all likely to vote. These voters should not be included in a poll and pollsters will exclude these respondents when filtering for likely voters. Pollsters know that inclusion of these respondents changes the numbers substantially, so why include them? Not only will these voters not vote, but many voters who self-report as likely to vote, and even some who say they are certain to vote, will also not vote. There are ways of screening out these respondents but pollsters claim it's too early to do this. If that's the case then it's too early to take polls seriously but the media reports them nonstop with major headlines. Bottom line, this category of somewhat likely to vote or will not vote at all is low hanging fruit for a pollster seeking likely voters (accuracy). I will consider this poll's results once it imposes a likely voter screen. The results are too out of the mainstream to ignore the NYT and Sienna's refusal to impose a likely voter screen. Excluded from this average for oversampling Democrats at D+6 and clearly needing to filter for likely voters. |
Excluded from our average |
|
|
| Change Research |
6/12-6/14 |
Undefined subset of 2408LV, Party Distribution Unavailable |
Biden 49, Trump 46 |
|
|
| Change Research |
5/29-5/31 |
Undefined subset of 3958LV, Party Distribution Unavailable |
Biden 46, Trump 50 |
|
|
| Redfield & Wilton |
5/10-5/14 |
963LV, Party distribution unavailable |
Biden 48, Trump 39 |
|
|
| Political Ref's Take on the above poll |
|
Biden 47, Trump 40 |
|
|
| Pennsylvania Statewide (Hodas & Assoc) |
5/9-5/13 |
600LV, 36.7D/20.1I/43.2R |
45.5 Biden, 50.2 Trump |
|
|
| Political Ref's Take on the above poll |
The party distribution in this poll oversamples Republicans. 36.7D/20.1I/43.2R. The 2016 exit polls showed 42D/20I/39R. But the exit polls also incorrectly predicted a Clinton win, so it was probably closer to an even party split, something like 40D/20I/40, adjusted result finds 48.5 Biden, 47.2 Trump. |
48.5 Biden, 47.2 Trump |
|
|
To see results of 2016 Pennsylvania polls below, click here
Best 2016 Pennsylvania Poll: Trafalgar Group
Polls that got Pennsylvania right: Alliance/ESA
Polls that got Pennsylvania wrong: Google Consumer Surveys, Reuters/Ipsos, UPI/CVoter, Survey Monkey, CCES/YouGov, CBS/YouGov, Clarity Campaign Labs, Muhlenberg College, Harper Polling, Gravis, PPP, Susquehanna Polling, Monmouth, CNN/OpRes, Quinnipiac, Remington Research |


